Posted inAI工作流 如何利用 AI 進行美股季報分析:用同一套框架判斷預期差 利用AI工作流可以在2分鐘內完成資料分析,大幅節省蒐集、摘要、分析的時間,把時間留給決策過程。透過統一框架檢查 Guidance、成長、獲利、估值與股價反應,投資人可以橫向比較不同公司,判斷報告結論偏多、中性或偏空。 Posted by Richard Lo 2026 年 5 月 1 日 Posted in美股個股 2026年第一季「TOP 30 成長股」 本篇整理 2026 年第一季 Top 30 成長股,從 61 家中小型股名單出發,聚焦高品質有機成長。名單主軸集中在商業化生技、AI 基建零組件與金融科技平台,並補充遺珠之憾,作為下一季選股追蹤清單。 Posted by Richard Lo 2026 年 4 月 24 日 Posted in市場趨勢 2026第二季美股市場分析 2026年美股在美伊衝突、油價與通膨擾動下快速修復,市場底部出現在不確定性最高時點。資金迅速回到AI主線,半導體與AI供應鏈成為獲利上修核心。Hyperscaler持續擴大資本支出,支撐NVIDIA、Micron等上游需求。聯準會未必降息,但財政偏擴張,資金環境仍略偏寬鬆。現有風險暫難讓市場再測前低。 Posted by Richard Lo 2026 年 4 月 21 日 Posted in市場趨勢 美股個股 2026 AI 與先進製程帶動下,半導體設備景氣再起 2026年AI算力需求推動記憶體技術迎來關鍵變革。此趨勢引發了半導體設備與材料供應鏈的強勁上升循環。隨著台積電與美光等大廠明確擴大資本支出以佈局先進製程與封裝,具備極高技術護城河的設備商如ASML(光刻)、Lam Research(蝕刻與沉積)及Teradyne(最終測試)將成為核心受惠者。 Posted by Richard Lo 2026 年 3 月 20 日 Posted in市場趨勢 2026 年光通訊產業研究:AI 資本支出浪潮下投資策略怎麼選 2026 年 AI 資本支出聚焦傳輸效率,銅線瓶頸推動產業確立「短距用銅、長距用光」架構,。投資邏輯鎖定 800G/1.6T 升級潮,價值鏈由模組廠向上游轉移,。市場首選掌握磷化銦(InP)等稀缺材料的垂直整合 IDM 廠(如 Lumentum、Coherent),以及定義規格的平台商,。技術關注矽光子與 CPO 發展,而 Retimer 則為銅線過渡期關鍵,。資金青睞具高技術門檻的寡頭勝過紅海競爭者。 Posted by Richard Lo 2026 年 2 月 15 日 Posted in市場趨勢 存儲產業的AI超級週期,為何這次不一樣? 2026年的AI投資,最需要先搞懂「存儲」。AI基建推升HBM成存儲瓶頸,記憶體由循環轉結構成長;供給受後段封裝/良率限制,鬆動估到2027H2;財測上修最密集仍在接下來 2–3 個財報季。 Posted by Richard Lo 2026 年 2 月 2 日
Posted in美股個股 2026年第一季「TOP 30 成長股」 本篇整理 2026 年第一季 Top 30 成長股,從 61 家中小型股名單出發,聚焦高品質有機成長。名單主軸集中在商業化生技、AI 基建零組件與金融科技平台,並補充遺珠之憾,作為下一季選股追蹤清單。 Posted by Richard Lo 2026 年 4 月 24 日 Posted in市場趨勢 2026第二季美股市場分析 2026年美股在美伊衝突、油價與通膨擾動下快速修復,市場底部出現在不確定性最高時點。資金迅速回到AI主線,半導體與AI供應鏈成為獲利上修核心。Hyperscaler持續擴大資本支出,支撐NVIDIA、Micron等上游需求。聯準會未必降息,但財政偏擴張,資金環境仍略偏寬鬆。現有風險暫難讓市場再測前低。 Posted by Richard Lo 2026 年 4 月 21 日 Posted in市場趨勢 美股個股 2026 AI 與先進製程帶動下,半導體設備景氣再起 2026年AI算力需求推動記憶體技術迎來關鍵變革。此趨勢引發了半導體設備與材料供應鏈的強勁上升循環。隨著台積電與美光等大廠明確擴大資本支出以佈局先進製程與封裝,具備極高技術護城河的設備商如ASML(光刻)、Lam Research(蝕刻與沉積)及Teradyne(最終測試)將成為核心受惠者。 Posted by Richard Lo 2026 年 3 月 20 日 Posted in市場趨勢 2026 年光通訊產業研究:AI 資本支出浪潮下投資策略怎麼選 2026 年 AI 資本支出聚焦傳輸效率,銅線瓶頸推動產業確立「短距用銅、長距用光」架構,。投資邏輯鎖定 800G/1.6T 升級潮,價值鏈由模組廠向上游轉移,。市場首選掌握磷化銦(InP)等稀缺材料的垂直整合 IDM 廠(如 Lumentum、Coherent),以及定義規格的平台商,。技術關注矽光子與 CPO 發展,而 Retimer 則為銅線過渡期關鍵,。資金青睞具高技術門檻的寡頭勝過紅海競爭者。 Posted by Richard Lo 2026 年 2 月 15 日 Posted in市場趨勢 存儲產業的AI超級週期,為何這次不一樣? 2026年的AI投資,最需要先搞懂「存儲」。AI基建推升HBM成存儲瓶頸,記憶體由循環轉結構成長;供給受後段封裝/良率限制,鬆動估到2027H2;財測上修最密集仍在接下來 2–3 個財報季。 Posted by Richard Lo 2026 年 2 月 2 日
Posted in市場趨勢 2026第二季美股市場分析 2026年美股在美伊衝突、油價與通膨擾動下快速修復,市場底部出現在不確定性最高時點。資金迅速回到AI主線,半導體與AI供應鏈成為獲利上修核心。Hyperscaler持續擴大資本支出,支撐NVIDIA、Micron等上游需求。聯準會未必降息,但財政偏擴張,資金環境仍略偏寬鬆。現有風險暫難讓市場再測前低。 Posted by Richard Lo 2026 年 4 月 21 日 Posted in市場趨勢 美股個股 2026 AI 與先進製程帶動下,半導體設備景氣再起 2026年AI算力需求推動記憶體技術迎來關鍵變革。此趨勢引發了半導體設備與材料供應鏈的強勁上升循環。隨著台積電與美光等大廠明確擴大資本支出以佈局先進製程與封裝,具備極高技術護城河的設備商如ASML(光刻)、Lam Research(蝕刻與沉積)及Teradyne(最終測試)將成為核心受惠者。 Posted by Richard Lo 2026 年 3 月 20 日 Posted in市場趨勢 2026 年光通訊產業研究:AI 資本支出浪潮下投資策略怎麼選 2026 年 AI 資本支出聚焦傳輸效率,銅線瓶頸推動產業確立「短距用銅、長距用光」架構,。投資邏輯鎖定 800G/1.6T 升級潮,價值鏈由模組廠向上游轉移,。市場首選掌握磷化銦(InP)等稀缺材料的垂直整合 IDM 廠(如 Lumentum、Coherent),以及定義規格的平台商,。技術關注矽光子與 CPO 發展,而 Retimer 則為銅線過渡期關鍵,。資金青睞具高技術門檻的寡頭勝過紅海競爭者。 Posted by Richard Lo 2026 年 2 月 15 日 Posted in市場趨勢 存儲產業的AI超級週期,為何這次不一樣? 2026年的AI投資,最需要先搞懂「存儲」。AI基建推升HBM成存儲瓶頸,記憶體由循環轉結構成長;供給受後段封裝/良率限制,鬆動估到2027H2;財測上修最密集仍在接下來 2–3 個財報季。 Posted by Richard Lo 2026 年 2 月 2 日
Posted in市場趨勢 美股個股 2026 AI 與先進製程帶動下,半導體設備景氣再起 2026年AI算力需求推動記憶體技術迎來關鍵變革。此趨勢引發了半導體設備與材料供應鏈的強勁上升循環。隨著台積電與美光等大廠明確擴大資本支出以佈局先進製程與封裝,具備極高技術護城河的設備商如ASML(光刻)、Lam Research(蝕刻與沉積)及Teradyne(最終測試)將成為核心受惠者。 Posted by Richard Lo 2026 年 3 月 20 日 Posted in市場趨勢 2026 年光通訊產業研究:AI 資本支出浪潮下投資策略怎麼選 2026 年 AI 資本支出聚焦傳輸效率,銅線瓶頸推動產業確立「短距用銅、長距用光」架構,。投資邏輯鎖定 800G/1.6T 升級潮,價值鏈由模組廠向上游轉移,。市場首選掌握磷化銦(InP)等稀缺材料的垂直整合 IDM 廠(如 Lumentum、Coherent),以及定義規格的平台商,。技術關注矽光子與 CPO 發展,而 Retimer 則為銅線過渡期關鍵,。資金青睞具高技術門檻的寡頭勝過紅海競爭者。 Posted by Richard Lo 2026 年 2 月 15 日 Posted in市場趨勢 存儲產業的AI超級週期,為何這次不一樣? 2026年的AI投資,最需要先搞懂「存儲」。AI基建推升HBM成存儲瓶頸,記憶體由循環轉結構成長;供給受後段封裝/良率限制,鬆動估到2027H2;財測上修最密集仍在接下來 2–3 個財報季。 Posted by Richard Lo 2026 年 2 月 2 日
Posted in市場趨勢 2026 年光通訊產業研究:AI 資本支出浪潮下投資策略怎麼選 2026 年 AI 資本支出聚焦傳輸效率,銅線瓶頸推動產業確立「短距用銅、長距用光」架構,。投資邏輯鎖定 800G/1.6T 升級潮,價值鏈由模組廠向上游轉移,。市場首選掌握磷化銦(InP)等稀缺材料的垂直整合 IDM 廠(如 Lumentum、Coherent),以及定義規格的平台商,。技術關注矽光子與 CPO 發展,而 Retimer 則為銅線過渡期關鍵,。資金青睞具高技術門檻的寡頭勝過紅海競爭者。 Posted by Richard Lo 2026 年 2 月 15 日 Posted in市場趨勢 存儲產業的AI超級週期,為何這次不一樣? 2026年的AI投資,最需要先搞懂「存儲」。AI基建推升HBM成存儲瓶頸,記憶體由循環轉結構成長;供給受後段封裝/良率限制,鬆動估到2027H2;財測上修最密集仍在接下來 2–3 個財報季。 Posted by Richard Lo 2026 年 2 月 2 日
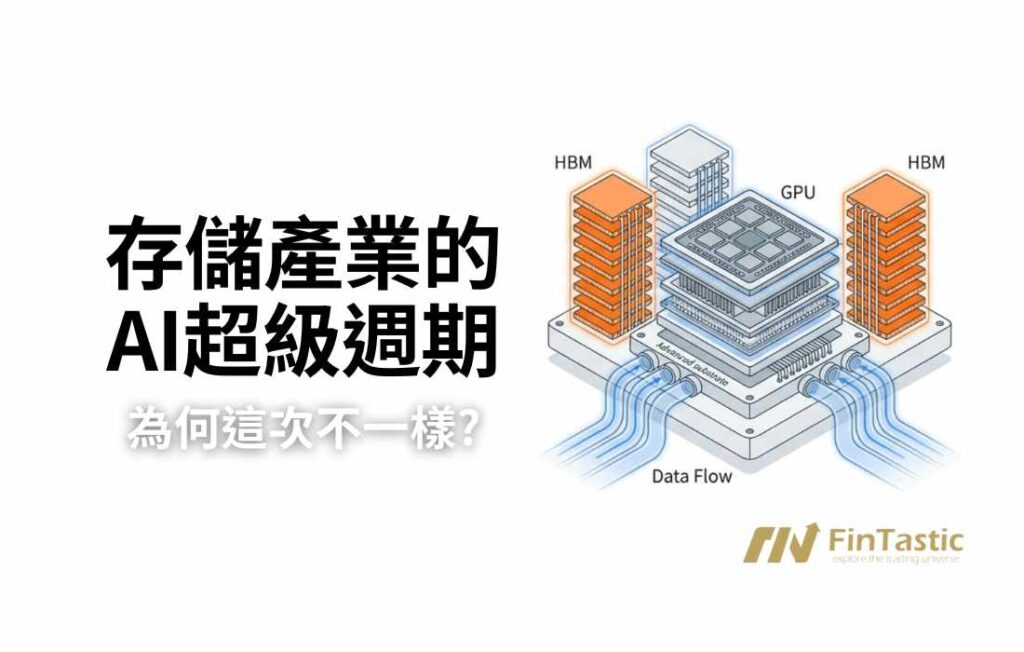
Posted in市場趨勢 存儲產業的AI超級週期,為何這次不一樣? 2026年的AI投資,最需要先搞懂「存儲」。AI基建推升HBM成存儲瓶頸,記憶體由循環轉結構成長;供給受後段封裝/良率限制,鬆動估到2027H2;財測上修最密集仍在接下來 2–3 個財報季。 Posted by Richard Lo 2026 年 2 月 2 日
Posted inAI工作流 如何利用 AI 進行美股季報分析:用同一套框架判斷預期差 利用AI工作流可以在2分鐘內完成資料分析,大幅節省蒐集、摘要、分析的時間,把時間留給決策過程。透過統一框架檢查 Guidance、成長、獲利、估值與股價反應,投資人可以橫向比較不同公司,判斷報告結論偏多、中性或偏空。 Posted by Richard Lo 2026 年 5 月 1 日
Posted in美股個股 2026年第一季「TOP 30 成長股」 本篇整理 2026 年第一季 Top 30 成長股,從 61 家中小型股名單出發,聚焦高品質有機成長。名單主軸集中在商業化生技、AI 基建零組件與金融科技平台,並補充遺珠之憾,作為下一季選股追蹤清單。 Posted by Richard Lo 2026 年 4 月 24 日
Posted in市場趨勢 2026第二季美股市場分析 2026年美股在美伊衝突、油價與通膨擾動下快速修復,市場底部出現在不確定性最高時點。資金迅速回到AI主線,半導體與AI供應鏈成為獲利上修核心。Hyperscaler持續擴大資本支出,支撐NVIDIA、Micron等上游需求。聯準會未必降息,但財政偏擴張,資金環境仍略偏寬鬆。現有風險暫難讓市場再測前低。 Posted by Richard Lo 2026 年 4 月 21 日
Posted in市場趨勢 美股個股 2026 AI 與先進製程帶動下,半導體設備景氣再起 2026年AI算力需求推動記憶體技術迎來關鍵變革。此趨勢引發了半導體設備與材料供應鏈的強勁上升循環。隨著台積電與美光等大廠明確擴大資本支出以佈局先進製程與封裝,具備極高技術護城河的設備商如ASML(光刻)、Lam Research(蝕刻與沉積)及Teradyne(最終測試)將成為核心受惠者。 Posted by Richard Lo 2026 年 3 月 20 日
Posted in市場趨勢 2026 年光通訊產業研究:AI 資本支出浪潮下投資策略怎麼選 2026 年 AI 資本支出聚焦傳輸效率,銅線瓶頸推動產業確立「短距用銅、長距用光」架構,。投資邏輯鎖定 800G/1.6T 升級潮,價值鏈由模組廠向上游轉移,。市場首選掌握磷化銦(InP)等稀缺材料的垂直整合 IDM 廠(如 Lumentum、Coherent),以及定義規格的平台商,。技術關注矽光子與 CPO 發展,而 Retimer 則為銅線過渡期關鍵,。資金青睞具高技術門檻的寡頭勝過紅海競爭者。 Posted by Richard Lo 2026 年 2 月 15 日
Posted in市場趨勢 存儲產業的AI超級週期,為何這次不一樣? 2026年的AI投資,最需要先搞懂「存儲」。AI基建推升HBM成存儲瓶頸,記憶體由循環轉結構成長;供給受後段封裝/良率限制,鬆動估到2027H2;財測上修最密集仍在接下來 2–3 個財報季。 Posted by Richard Lo 2026 年 2 月 2 日
Posted in市場趨勢 2026 灰犀牛:OpenAI 的 1.15 兆豪賭與美股 AI 敘事的轉折點 2026年 OpenAI 告別純訂閱模式,轉向廣告與分層收費的混合策略,試圖填補高達 1.15 兆美元的基礎設施錢坑。面對 Google 生態系的市占率侵蝕及 Elon Musk 的千億美元訴訟,OpenAI 面臨巨大的現金流缺口。若變現不及預期,恐面臨被收購命運,更將引發 AI 供應鏈嚴重的估值修正。 Posted by Richard Lo 2026 年 1 月 21 日
Posted inAI工作流 【AI 投資工作流】從 Gemini 搜尋到 NotebookLM 深度理解:打造美股分析系統 AI 賦能的投資工作流:整合 Google Gemini 市場偵查、NotebookLM 深度研判與 FinTasticRS 量化動能數據。從自動化個股分析、五象限評分到 Notion 決策庫構建,將兩天工時壓縮至兩小時,協助投資人從數據蒐集者轉型為具備第二層思考的決策司令官。 Posted by Richard Lo 2026 年 1 月 14 日
Posted in市場趨勢 閱讀筆記 景氣循環投資的終極指南:地圖、時鐘與鏡子,三位大師的致勝策略 景氣循環投資是「由上而下」的戰略藝術。透過愛榭克的「地圖」定位宏觀座標、浦上邦雄的「時鐘」掌握板塊輪動,以及霍華·馬克斯的「鏡子」控管風險心態,投資人能建構完整的決策體系。面對當前 AI 敘事與傳統產業脫鉤的「雙軌市場」,建議聚焦真實業績支撐的投資標的。 Posted by Richard Lo 2026 年 1 月 5 日
Posted in交易策略 市場趨勢 美股ETF 【資產配置】AI 時代的「金、銀、銅超級循環」與啞鈴式配置策略 解析金銀銅超級循環,受 AI 基建與財政隱憂驅動。主張「啞鈴式配置」,結合科技成長股與優質礦商ETF(GDX、SIL、COPX),利用低相關性降低波動,建構「軟硬兼施」的抗脆弱投資組合。 Posted by Richard Lo 2025 年 12 月 26 日
Posted in市場趨勢 拆解 AI 資料中心建設成本與完整全球供應鏈 科技巨頭AGI競賽全面升級為基礎設施較量。本文拆解1GW資料中心成本結構,提出三大投資濾網:擁抱「產能瓶頸」(如HBM、電力設備)、鎖定「高毛利壟斷」(如NVIDIA)、佈局「高技術壁壘」(如液冷、光通訊)。協助投資人避開紅海,精準捕捉AI基建核心標的。 Posted by Richard Lo 2025 年 12 月 6 日
Posted in美股個股 Lumentum (LITE) AI資料中心的光速神經網絡 Lumentum (LITE) 為 AI 光通訊核心玩家,營收年增58%,擁有 InP 晶圓廠與光路交換機 (OCS) 技術,與 COHR 雙寡頭壟斷高階雷射晶片市場。泰國廠產能爬坡與 1.6T 模組放量將推動毛利率挑戰 40%。其在 Hyperscaler 供應鏈中的獨特垂直整合優勢,使其成為AI基建紅利的首選標的之一。 Posted by Richard Lo 2025 年 12 月 5 日
Posted in交易策略 選擇權 放空波動率的期權策略:日曆價差與雙對角價差 本文揭示如何利用日曆價差策略賺取波動率隨時間下降的利潤。當波動率期限結構出現逆價差,可採用雙對角價差策略,建構寬廣的「M型」獲利區間,捕捉財報後波動率崩跌的回歸利潤。將市場的過度恐慌轉化為穩健的交易優勢。 Posted by Richard Lo 2025 年 12 月 1 日
Posted in市場趨勢 2026全球投資展望:華爾街群雄逐鹿 AI、關稅與聯準會共舞 華爾街展望2026年,標普500上看8,000點,AI實質獲利與聯準會降息將是核心動能,但川普政策與通膨仍是最大變數。本文彙整各大投行觀點,並特別整理「散戶實戰筆記」,建議投資人將目光從科技巨頭擴散至電力、原物料等AI基礎設施,同時保留現金與黃金應對波動,協助您在變局中精準佈局。 Posted by Richard Lo 2025 年 12 月 1 日
Posted in市場趨勢 美股個股 2025第四季「TOP 30 成長股」 隨著 2025 年第三季財報季落幕,我們再次透過嚴格篩選,鎖定 30 檔具備強勁爆發力的中小型成長股。本季名單由 AI 基礎建設(連接晶片、伺服器)與邁入商業化收割期的生技類股主導,顯示市場資金正高度集中於實質營收動能。 Posted by Richard Lo 2025 年 11 月 30 日
Posted in交易策略 選擇權 自動加碼的藝術:利用「股票 + 買權」建立正凸性(Convexity)部位的交易指南 在交易世界中,「截斷虧損,讓獲利奔跑」是每位交易者的聖杯,但執行上卻充滿人性障礙。本文探討一種基於量化金融的「正凸性(Positive Convexity)」策略,透過結合現股與價外買權(OTM Call),構建一個能隨著價格上漲自動放大槓桿、價格下跌自動縮減曝險的投資組合。 Posted by Richard Lo 2025 年 11 月 29 日
Posted in交易心理學 閱讀筆記 《操盤手的秘訣: 最懂輸的人才能成為贏家》書籍內容整理 《操盤手的秘訣》指出交易致勝關鍵非技術分析,而在於情緒管理。作者強調「最懂輸的人才能贏」,透過「三大指令」克服人性弱點:在獲利時違背本能勇敢加碼,虧損時果斷止損。唯有掌握輸的藝術,讓利潤奔跑,才能從 95% 的輸家中脫穎而出,成為市場最終贏家。 Posted by Richard Lo 2025 年 11 月 28 日
Posted in交易策略 認識期貨與選擇權 選擇權 從被動的「設停損」,進化為主動的「結構性防禦」- 為投資組合裝上「反脆弱」裝甲 針對熱愛科技股卻難耐波動的投資者,提出以「Put-Spread Collar」策略取代傳統停損。構建零成本的下跌緩衝區。文章結合摩根大通 JHEQX 基金實證與 OptionStrat 操作教學,詳解如何為資產裝上「結構性避震器」,建立「反脆弱」體質,讓投資者有「抱得住」的底氣,將被動恐懼轉為主動防禦。 Posted by Richard Lo 2025 年 11 月 26 日
Posted in交易策略 【SMC 交易入門】讀懂主力的腳印:基礎進場策略全解析 本文深入解析 SMC(聰明錢概念) 交易策略,揭示如何追隨機構大戶的資金流向。核心流程涵蓋四大步驟:首先確認大趨勢,接著識別 「假跌破」 的流動性陷阱,等待 「結構改變(CHOCH)」 確認反轉訊號,最後鎖定 「訂單塊(OB)」 與 「公平價值缺口(FVG)」 進行精準掛單。這套系統化策略將協助交易者克服追漲殺跌的弱點,掌握與主力同步進場的高勝率契機。 Posted by Richard Lo 2025 年 11 月 25 日
Posted in智慧碎片 認識期貨與選擇權 選擇權 【進階希臘字母】Opex周的美股「神秘力量」- Vanna 效應 這篇文章揭開美股月底「易漲難跌」或「瞬間崩盤」背後的微結構真相。深入解析造市商(Dealer)的避險邏輯,闡述 Vanna 與 Charm 如何在結算週驅動行情。文中詳解 正 Gamma 下的 Vanna Rally 與 負 Gamma 下的 Vanna Crash 運作機制,並提供 VIX 異常訊號 的實戰判讀矩陣,助您看懂市場「隱形的手」,避開流動性崩潰,掌握高勝率進場點。 Posted by Richard Lo 2025 年 11 月 24 日
Posted in交易心理學 交易策略 市場趨勢 當恐懼成為你的敵人:在這個演算法主導的瘋狂市場,如何用「儀表板」戰勝本能? 本文剖析「恐懼情緒」如何主導短期股市,特別聚焦於現代交易結構如選擇權爆量與 GEX 效應如何加劇波動。警示非理性拋售的風險。同時分享實戰心法,教導投資人觀察 VIX、信貸利差與市場廣度等客觀指標,在極度恐慌中冷靜判斷,克服人性弱點並化危機為轉機。 Posted by Richard Lo 2025 年 11 月 21 日
Posted in美股個股 AI 廣告現金怪獸:AppLovin(APP)如何用 AXON 賺出 80% 利潤率? AppLovin 最新一季營收年增 68%,調整後 EBITDA Margin 高達 82%,自由現金流率約 75%,財務體質遠勝多數 AdTech 同業。透過 AXON AI 與自助式廣告投放,積極擴大 Web 廣告主與 CTV 市場。2025 年被納入 S&P 500、信用評級升至投資等級。不過,在高估值、SEC 調查與做空質疑背景下,股價波動偏大。 Posted by Richard Lo 2025 年 11 月 21 日
Posted in市場趨勢 史詩級的多空對決:當「大賣空」遇上「AI 信仰三巨頭」 2025 年末,華爾街在 AI 基礎建設上嚴重分裂:Burry 指控雲端巨頭把 3 年壽命的 GPU 當成 6 年資產,營收又被創投與雲端「左手換右手」灌水,AI Capex 已接近歷史泡沫高點;多頭三巨頭則認為 AI 是新工業革命,企業端與傳統產業需求真實存在,軟體乘數與國家級意志會支撐算力投資。關鍵變數落在 OpenAI 與 5,000 億 Stargate 能否用真實獲利與微軟/政府護航度過折舊與現金流考驗。 Posted by Richard Lo 2025 年 11 月 20 日
Posted in美股個股 「高成長、高獲利、低估值?」FUTU:被中概身份耽誤的數位券商龍頭 Futu 是一家「高獲利」的數位券商。最新Q3財報顯示,營收年成長 +86.3%,非 GAAP 淨利年成長 +136.9%,受益於港、美股交易量放大,以及財富管理 AUM 和保證金餘額激增。毛利率已逼近 90%,營業利益率超過 60%,在全球同類型券商裡幾乎是「頂規」。但中概 ADR+跨境券商的身分讓它的估值相對「便宜」 。 Posted by Richard Lo 2025 年 11 月 19 日
Posted in美股個股 AI世代資料暴增:WDC 如何用最低 $/TB 在 AI 資料中心加持下成長 Western Digital 透過高容量 nearline HDD 抓住 AI 資料湖與冷資料需求,從景氣循環股「升級」為 AI 基建成長股。AI 儲存需求將以20%+的年複合成長率擴張。Q3營收年增 27%+、營運利潤翻倍。並用分拆 SNDK 降槓桿、啟動回購與股利。WDC 可被視為「AI 儲存核心持股」。 Posted by Richard Lo 2025 年 11 月 18 日
Posted in美股個股 資料中心離不開 MEMS 計時 – SiTime 如何重塑高精度時序版圖? SiTime 以 MEMS 計時切入 GPU/交換器等高階場景,Q3 營收年增 45%,CED 年增逾倍。管理層看 Q4 突破 $100M,長線受惠 AI CapEx。Titan 與時鐘 IC 補齊產品線,形成一站式方案。 Posted by Richard Lo 2025 年 11 月 17 日
Posted in美股個股 AI Factory燒錢擴張獲利受質疑:CRWV 要達成哪些條件才能「投資」? 表面看起來,CRWV Q3 是一份漂亮的高成長財報;但深入現金流、折舊與利息結構後,故事就沒那麼簡單了。本文帶你從「獲利品質」角度重新閱讀財報,討論 AI Factory 模式為何容易落入低利潤+高風險,並整理未來幾季值得追蹤的關鍵指標,作為布局或觀望的依據。 Posted by Richard Lo 2025 年 11 月 17 日
Posted in美股個股 FinTech × AI風控:Pagaya如何把銀行拒件重新變現? Pagaya(PGY)以 AI 風控連結銀行與資本市場的 FinTech 平台。Q3 營收 3.50 億、年增 36%,Adj. EBITDA 率 30%+、FRLPC% 5%,量收利三升。輕資產、不承擔壞帳,估值仍低於同業,降息循環可望放大成長彈性。 Posted by Richard Lo 2025 年 11 月 13 日
Posted in美股個股 AI 資料中心缺電潮,Solaris 的「電力即服務」崛起,EBIT比出租GPU算力還吃香 Solaris Energy Infrastructure(… Posted by Richard Lo 2025 年 11 月 11 日
Posted in美股個股 Robinhood Q3:多線齊發的FinTech平台,成長與獲利雙滿分 HOOD交出「成長×獲利」雙高標:營收12.74億美元、YoY+100%,EPS YoY+259%。事件合約爆量、Bitstamp補齊國際執照與機構客,平台資產與ARPU走高。雖估值緊繃,若量能未明顯轉弱,長線仍具平台級想像空間。 Posted by Richard Lo 2025 年 11 月 9 日